The phrase “sales funnel” often flashes in business publications and various reports. On an intuitive level, the meaning of this concept is clear enough, but, as I already wrote, a businessman should have a firm grasp of the basic terms in the field of economics. So let’s make a small educational program.
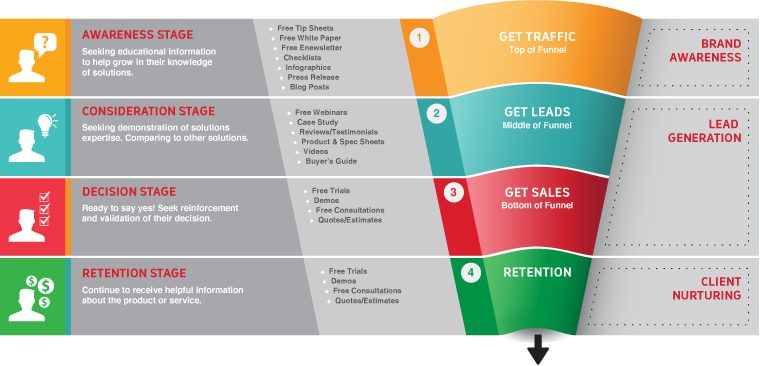
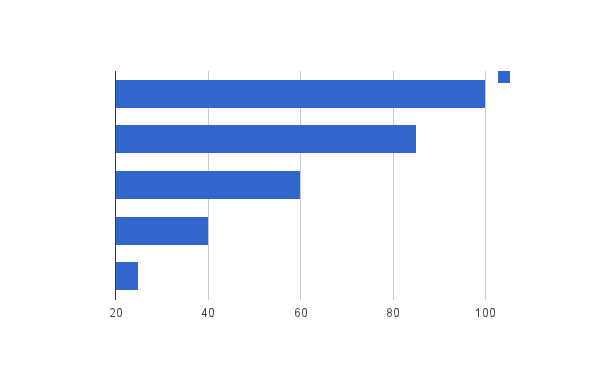
The sales funnel is a graphic display of the process of the movement of orders (work with customers) in a particular company (its department, a particular manager). In fact, it’s just a bar chart (histogram), which is presented in a special form. This form causes a variety of associations and allows you to analyze the sales process, not only logically, but also emotionally; In addition, the funnel diagram is extremely convenient in the process of comparing several different customer flows.
Such a comparison is useful, for example, to evaluate the effectiveness of various advertising campaigns, to compare the results of work of different managers, and so on.
How to build a sales funnel?

It’s pretty simple. The process of working with clients is divided into a number of stages, for example …
- Receiving calls
- Submission of information
- Clarification of the terms of the contract in the office
- Conclusion of the contract
At each stage, a certain number of buyers “jumps”. If we construct a standard diagram of this process and rotate it by 90 degrees, we get something like this …

And if you finish this image with a mirror image – we will just get a funnel.
Of course. It is not necessary to draw a histogram. Different software complexes operate with different types, but the essence is usually well seen in any of the types.
What can the sales funnel analysis do?
Why is this necessary in practice?
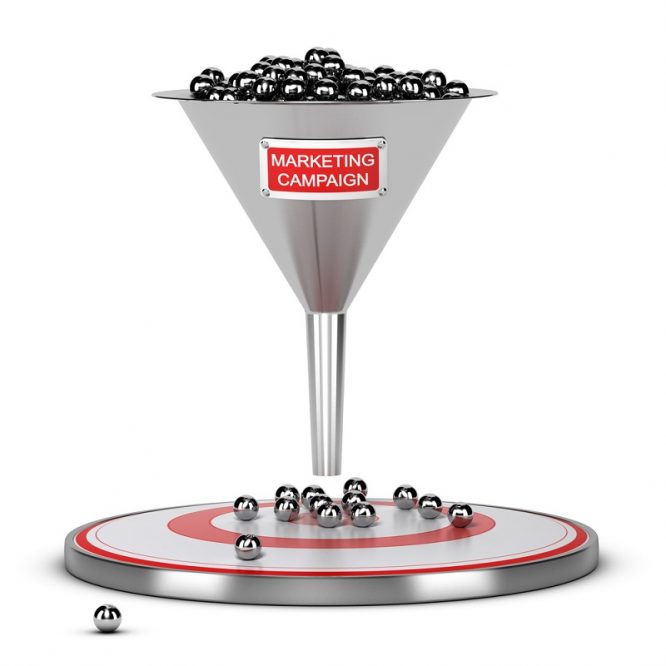
It’s simple – this graphic form allows you to quickly and easily evaluate the effectiveness of working with the target audience. The less the funnel narrows, the more it looks like a pipe, the better the business processes are built, and it immediately catches your eye.
Also, by analyzing different sections of the chart, you can identify problem points and opportunities to increase turnover. Again – you can quickly (literally – by eye) evaluate at what stage is lost, the maximum number of consumers is eliminated. And this is the first step to not losing them.

Estimating the throughput of the system and comparing it with plans to expand advertising campaigns, it is possible to forecast future turnovers and profits.
All this can also be used to work with staff, identify the most and least effective employees.
Finally, this is a good form for creating reports and presentations, presentations to investors (close in shape to the pipe, it can pleasantly warm their hearts).

