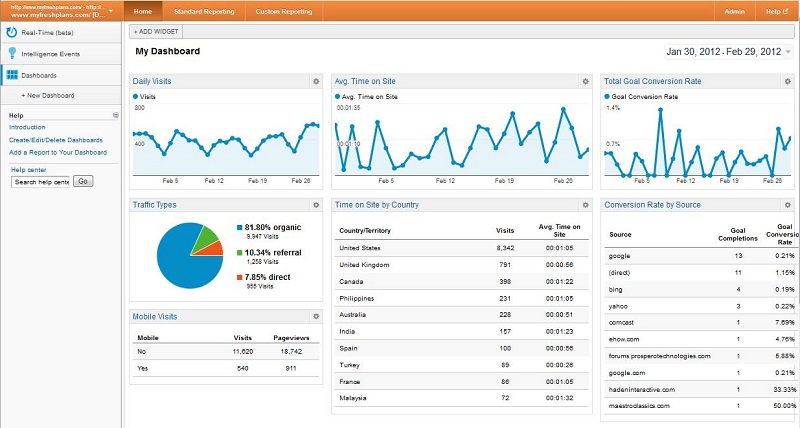
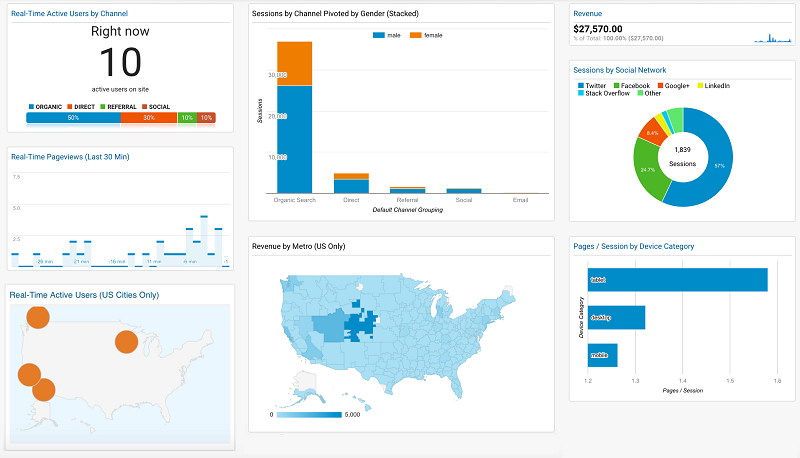
We are accustomed to consider Google Analytics as a tool (effective) to keep an eye on the traffic performance of our site.
We have learned over time to create a new account, or to monitor a new property, between reports investigating the behavior of our users. Google helps new users to deal with these first steps with ease. We also know that by connecting AdWords and Analytics, the latter will begin to gather important information from the country within a dedicated set of reports.
However, we often underestimate (or ignore completely) given the potential of analyzing the performance of a web site when hit by paid traffic. Here’s how to get started …
An architecture effectively
First, a very brief summary. In Analytics, we find between the division between settings Account, Property, and View. The Analytics account can contain one or more properties to be monitored (a website or an app). In turn, each property can contain one or more views.
At the time of Account creation Analytics and tracking of the first property, it is created by the system a first view, which contains all the data traffic.
When we look at our report, we are actually looking at the report of a single view of a single property traced, within an Account.
You can – and recommended – think about the quality and quality of present account views, in order to facilitate the analysis of the data.
The sense of Views
Why think about multiple views in the same property? To be able to filter the data that each view collects, in order to observe precise traffic portions on which to be able to concentrate better.
This approach is particularly useful when our site is home to two languages (a .com domain with sub-directory) or when whole portions of our site have a sense slightly different from each other (for example a company website that has a blog in a sub-directory, and a section devoted to resources for users registered in another).
Without a division in views adequately filtered, during the analysis of the reports, we should from time to time to skim traffic portions “polluted” by data from all over the site together.
A concrete example? If our site is home to two languages to the same domain and one of the two languages has a lot of traffic less reactive than the other, watching the traffic data overview reasoning on the residence or on the bounce rate time makes little sense. It will average data from all access to the site received. Improved analysis will necessarily be skimming and continuously filtering the report found.
Create a filtered view, once and for all, it makes it possible to decide in advance what portion of traffic to collect a Analytcs, answering all of our classic set of reports now more clean and focused.

Apply a filter
Apply a filter is a rather linear, which may take a few seconds for very simple filters. If necessary, one or more filters can be applied to the sight by acting on a variety of available settings.
Among the analytics options, level of Vista, the menu item “Filter” will allow us to add a new default filter or set different custom parameters for inclusion or exclusion.
One of the most common filters is the default type, and sees the inclusion of the traffic of only a sub-directory of the site. But more about that in a minute.
The three starting views
Over the years, it has consolidated in a certain way a winning approach to the use of the views, which sees the management of three basic views.
- The view “Raw data”
- The view “Test”
- The view “Master”
This is of course indicative names, which hide a very rational approach to the analysis of data.
Raw Data View
It is the original view. More likely, the one you are using already, with no filters applied or other settings, which affect data collection.
This view is used to collect all the traffic data without any exclusion, in order to have a reference point if in doubt on the quantity and quality of the data collected from the following views.
Test View
It is, as the name, a test Vista. It is that where put on the test bench:
- Filters
- Conversion goals
- Referral Exclusions
And all those aspects that can affect irreversibly on data collection between reports. Before confirm the goodness (and apply them on the Master View) is always good to test and evaluate a handful of days of such changes on the Test View.

Master View
It is the view that you are working every day. The one that you’re tracking conversion goals, stakeout E-commerce, making extensive use of segments on reports and everything that normally would consider the act in Analytics.
More Views tips
In an activity of web analysis on smaller projects, only three views shown above may be sufficient to establish a working routine foolproof.
A view “raw” which continues to collect all the traffic data; a test view in which to evaluate the effectiveness of the changes are not reversible and, once confirmed these changes, a main view on which actually work.
However, when we bring traffic to payment of a site, it becomes valuable to add more filtered views. You can add a new view in Analytics settings, scrolling through the drop-down menu of the view currently in use.
Sub-directories
The simplest and most intuitive of all the filtered views. Filter views will take up or exclude all traffic to your site URL corresponding to a sub-directory.
You can use this type of filter to collect only traffic to a section / blog, part of your e-commerce or parts of your site whose significance is likely to affect global statistics (supporting sections or resources downloads compared to more sections commercial).
Country
If yours is an e-commerce that will appeal to two or three countries in the world, it makes perfect sense to build more views sorted by country, in order to obtain more meaningful data looking only for traffic in each territory.
In this case (and in the following cases), speak of custom filters, where the field Exclude / Include who uses the “Filter field” country.
Source
Create a view that filters only a particular type of source. You can think only evidential traffic from social media (sources like Facebook, Twitter, LinkedIn and the like) or any other source you’re reporting in Google Analytics.
Again it is a custom filter, where the field Exclude / Include uses the “Filter field” Campaign Source.
Half
Similarly, to filter the source, you can use the “Filter field”: Up, indicating as “CPC” value, to filter all the paid traffic.
This is particularly useful to highlight the behavior of users whose browsing context we can clearly identify (as we ourselves have orchestrated the upstream ADV campaigns).
Some things to remember
Organize your views and create new views filtered by Google Analytics is pretty simple. Also remember that …
- Once filtered data to a view, you cannot restore the missing data within. Make sure you always have the three main views (Raw Data, Test and View) with particular attention to the views of the raw data, so that it contains all the raw data to be referenced.
- Each view can be copied and filtered, or you can create a new view from scratch. In this case, the newly created view will collect data from that point on.
- You can manage up to 25 views for single drawn properties
- Each view has its own resources: Objectives, Scheduled Emails, Custom alerts are specific to each view and will be replicated as needed.
- Put much attention to the cancellation of your views, since once removed, they cannot be restored.
Have you ever made use of advanced views in Google Analytics?

